
“Industry 5.0” explained in 800 words
We’ve barely started to understand the scope of the Fourth Industrial Revolution and some institutions are already heralding the dawn of the Fifth! So, if your head is spinning...
Read more
Most of us think visually and when talking about resource planning often the first thing that comes to mind are Gantt charts. Gantts are great for visually breaking down projects and establishing/communicating timelines, but anybody who has worked with Microsoft Project (or similar packages) knows that there are some cons lurking as well. (keeping it up to date, complexity, multiple projects, …)
At Binocs we have been contemplating how to include Gantts to increase visual understanding of work break downs and timeline communication, without sacrificing the ease of use we’re known for. We were searching for that Gantt chart sweet spot and we think we found it.
We included a Gantt layer into our demand management screens. You can add a Gantt layer on any folder in a demand channel with a push on the button, which will add a layer on top of your demand tree, visually showing the work breakdown in Gantt view.
No matter if you want to see the detailed Gantt of a work package, a higher level Gantt on the project or even a 10000 feet Gantt view on a group of projects, we’ve got you covered.
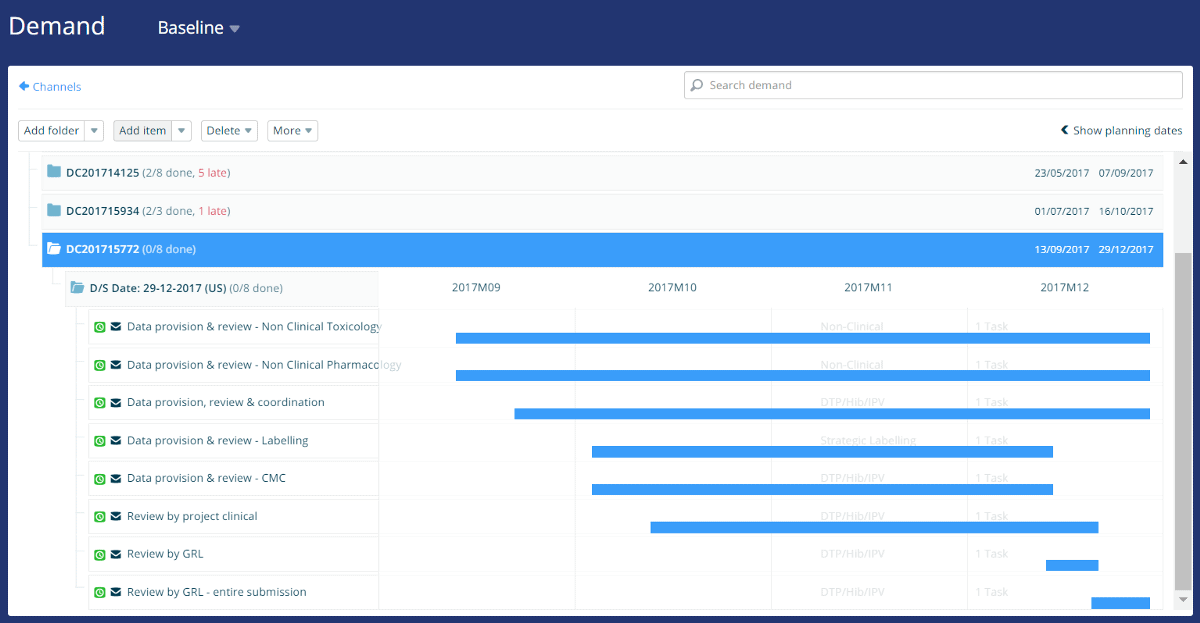
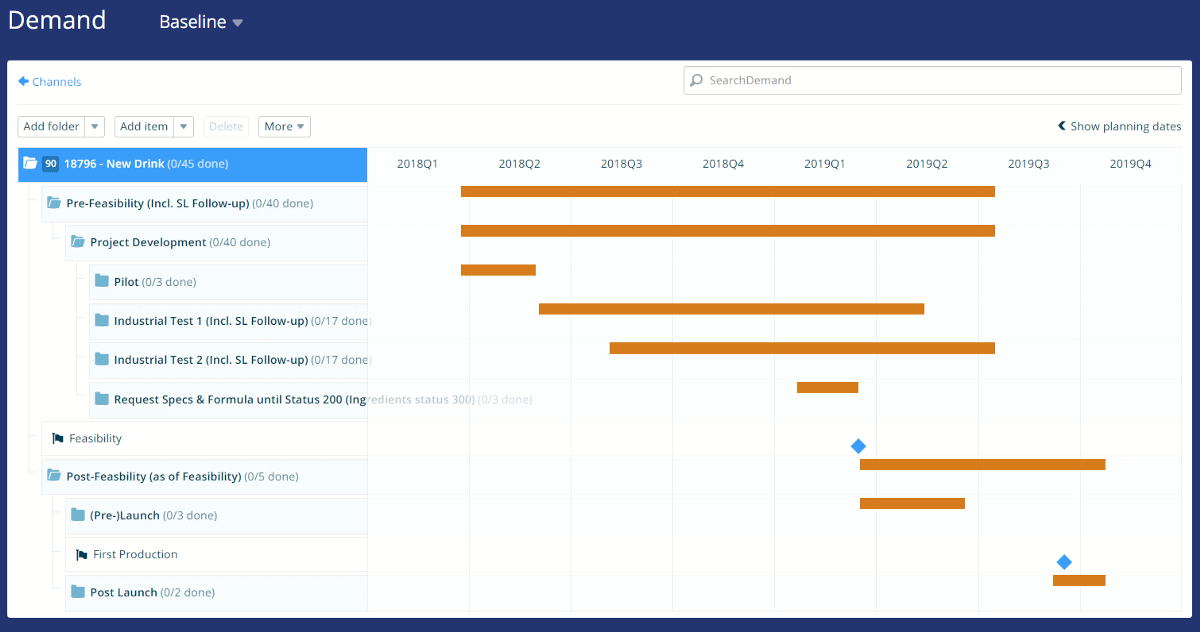
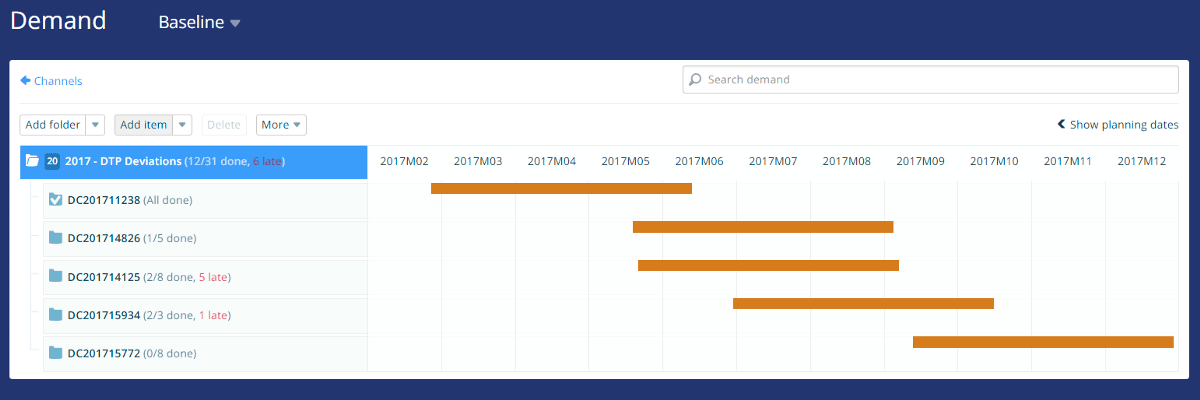
As it’s built on top of the existing demand management screens, you don’t have to learn new controls or ways of working. You can still easily edit timelines, while the visualization is Gantt style!
Whenever you read pros and cons of Gantts the following cons appear. Let me explain how we tackled those.
Keeping it up to date
Gantt charts are typically created in the beginning of a project and are often a “write once” document. Keeping them up to date is often neglected (due to not enough time).
At Binocs we have a zero input vision. Over the years we developed innovative ways to get demand created and updated almost fully automatic. As the Gantts are a layer on top of the demand, they will be updated automatically as well.
Gantts don’t show the complete picture
Gantt charts show what tasks need to be done and the timelines they should take. They don’t show how much work each task will involve or how many people/resources each task will require. Moreover, from a team perspective working on multiple projects and channels at once a Gantt is overly complex.
We’ve been refining our capacity utilization reports together with our clients for years now. These are not Gantt charts, but answer the capacity questions teams have in a better way. In other words, teams (the capacity side) need the complete picture and Binocs is already giving it to them.
We’ll release the Gantt view 19th of February. So from then on you can visually manage your project and other demand channels with Gantt views on different levels of detail. Happy Gantting!